
Closing the Gap: Employer Strategies for the Midwest’s Rising Cost of Living

The East North Central division (more colloquially known as the Midwest) spans five states—Illinois, Indiana, Michigan, Ohio, and Wisconsin—stretching from the Great Lakes to the Ohio River Valley. In this fourth post in our regional analysis series, we examine how costs and wages have shifted across the East North Central division since 2021, and what those trends mean for families and the employers navigating them.
Affordability advantage narrows, especially in Indiana
The East North Central division has historically been one of the nation’s more affordable locations. And the 2026 living wage data bears that out: at $27.91 per hour, the family-sustaining wage for a household of two working adults and two children sits just below the national average.
Recent cost growth, however, has narrowed the division’s affordability advantage. Between 2021 and 2026, the cost of supporting a family of four grew by 28.1%, with counties experiencing family budget growth of nearly $25,500 on average. Cost pressures were sharpest in Indiana, where family-sustaining costs grew 37.3%, almost seven percentage points higher than for Ohio, the next-highest state (30.6%).

Housing, health care, and childcare costs all climbing
Over the last six years, cost growth in the division has kept pace with more traditionally high-cost locales. For example, rental housing costs grew by 39.4% from 2021 to 2026, faster than the Pacific and West South Central divisions, and on par with the Middle Atlantic division.
Among major family budget items, health care costs have grown the fastest, rising 46% to just over $10,000 annually for a family of four. Health care cost growth was especially pronounced in Michigan, whose 79.4% growth was the third-fastest among all U.S. states. Wisconsin was close behind, with its 55.9% growth ranking 11th nationally.
Although housing and healthcare costs continue to drive budgets up, childcare is the single largest cost for division families. The typical division family saw childcare costs grow by 20.7% over six years, rising to $25,600 for a family of four. Indiana experienced the steepest childcare cost increases in the division at 55.9%, and the third-fastest among all U.S. states.

The local patterns behind cost growth
These division-level numbers, however, obscure wide variation in cost growth at the county level. In a previous post, we identified six cost pressure typologies across all 3,144 U.S. counties.
Approximately 44% of counties are high-cost locations where both housing and childcare costs continue to grow, the bulk of which are concentrated in Wisconsin metros, Illinois, and Ohio. Close to a quarter of counties are where cost growth has been steady across all categories, mostly in small town communities. Over a fifth of counties—exclusively in Indiana—have seen the steepest childcare cost growth. The remaining counties are suburban and metro counties that have seen housing and childcare costs stabilize; rural counties that have absorbed sharp childcare cost increases; or counties where childcare is easing but housing costs continue to climb.

What this means for local employers
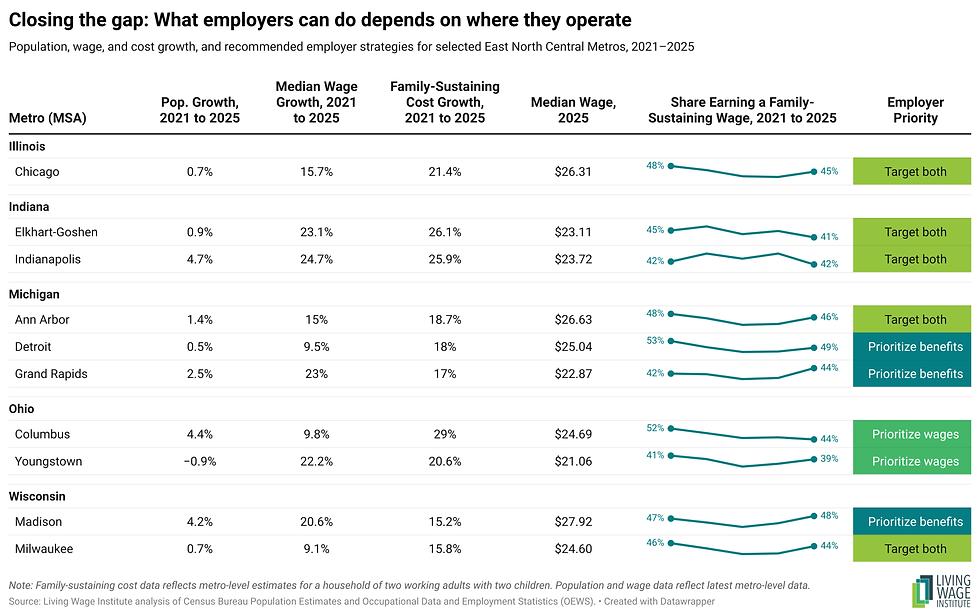
Zooming into the division's major metros, those typology patterns come into sharper focus. Many East North Central communities are still rebuilding their economic base on the remnants of a previous manufacturing era, and workers across the division's major metros are contending with significant cost growth on top of it. Childcare is the single largest cost driver in nine of the division's ten metros analyzed here, a pattern that holds across college towns, industrial cities, and state capitals alike. What varies from metro to metro is how fast wages and costs are growing, and how competitive wages are.
In markets like Ann Arbor, MI, Chicago, IL, and Milwaukee, WI, costs have outpaced pay despite higher wage levels. Ann Arbor has the highest wages among Michigan metros, yet family-sustaining costs outpaced median wages by 3.7 percentage points from 2021 to 2025. Wages are also high in Chicago, but costs have grown 5.7 percentage points faster than wages, with fewer workers earning a family-sustaining wage in 2025. For Milwaukee, wages are slightly above the division average, but costs have outrun pay significantly (6.7 percentage points), with childcare again the largest driver.
In contrast, workers in Elkhart and Indianapolis, Indiana have faced lower wages for some time. Wages in the Hoosier state have fallen from 95% of the national average in 2007 to 88% today. Cost growth—especially childcare costs—has further eroded the state’s low-cost edge, with family-sustaining budget growth exceeding wages by 3 percentage points in Elkhart and 1.2 in Indianapolis. Indianapolis also bears the brunt of low-wage challenges: with recent job growth primarily concentrated in low-wage roles, the metro has one of the largest living wage-to-median wage gaps in the division at $4.45 an hour. In all five metros, employers can support worker financial stability by raising wages—especially in Chicago and Indianapolis, where housing is the fastest-growing item—while targeted childcare benefits can help close what's left of the gap.
Despite family-sustaining costs outpacing wages by 8.5 percentage points, the typical Detroit, MI worker faces just a $0.69 gap between their median hourly pay and the family-sustaining wage, the smallest gap among the metros analyzed here. Madison, WI is even better positioned: median pay has grown 5.4 percentage points faster than costs since 2021, and workers in the metro earn the highest wages in the division, leaving just a $0.79 gap to close. In Grand Rapids, MI, wages have also outpaced costs by 6 percentage points since 2021, leaving a modest $2.77 gap to close. In all three metros, childcare is among the largest household costs, meaning targeted childcare benefits can help close living wage gaps for many workers. In Detroit specifically, healthcare costs have grown faster than any other expense, making a strong case for targeted health care benefits to complement childcare support.
In the Ohio metros of Columbus and Youngstown, fewer workers are earning enough to support a family of four than in 2021. In Columbus, family-sustaining costs have grown 29% since 2021—almost three times as fast as median wages—largely driven by housing cost growth, even as the metro added over 20,000 jobs last year alone. Youngstown's challenge is structural: at $21.06, its median wage is the lowest in the entire East North Central division, a legacy of the state's decades-long manufacturing decline and Youngstown’s low-wage job concentration. Even though wages there have grown faster than costs, the wage floor is low. For employers in both Columbus and Youngstown, wage competitiveness is the primary lever to support workers.
Widening gaps, differing pressures
Across the East North Central, cost growth has outpaced wages in most major metros, but the underlying pressure varies by location. In some places, like Indiana, it's a cost story: childcare and housing climbing faster than paychecks can absorb. In others, wages have been low for too long, even as wage growth keeps pace with costs. For employers, understanding which of these your market faces is the foundation for a total rewards strategy that improves worker’s ability to meet their basic needs.
Explore our data or connect with our team to factor our location-specific Wage Index database into your compensation planning, support workforce stability, and help address risks before they grow.